Choosing the right OEM Ceramic Tableware Manufacturer in 2026 requires more than comparing factory prices. Buyers must examine craftsmanship, production stability, material control, and communication quality. A beautiful sample can hide uneven glazing, weak rims, or inconsistent firing results.
Bernard Leach, a respected ceramics authority, wrote, “The essential quality of pottery is that it should be made by hand.” His view still matters, even in modern OEM production. Skilled workers remain essential when factories develop embossed plates, reactive glazes, hotel-grade bowls, or custom logo patterns. Automation improves consistency, but it cannot solve every design decision.
This guide introduces leading manufacturers and explains how to assess them. It considers porcelain, stoneware, bone china, and high-fired ceramic production. It also reviews mold development, color matching, food-contact testing, packaging protection, and export experience. These details affect whether a product survives a restaurant dishwasher, a long shipment, or daily family use.
The strongest suppliers usually provide clear samples, realistic minimum order quantities, and documented quality checks. Ask about firing temperatures. Ask how rejected pieces are handled. Small questions expose large weaknesses.
However, no ranking remains perfect forever. Factory capacity changes. Raw material costs move. Some online claims may be outdated. Buyers should verify certifications, visit facilities when possible, and test production samples before signing large orders. Price still matters, but unreliable quality can cost much more. This 2026 overview aims to support careful decisions, not promote one supplier without evidence.
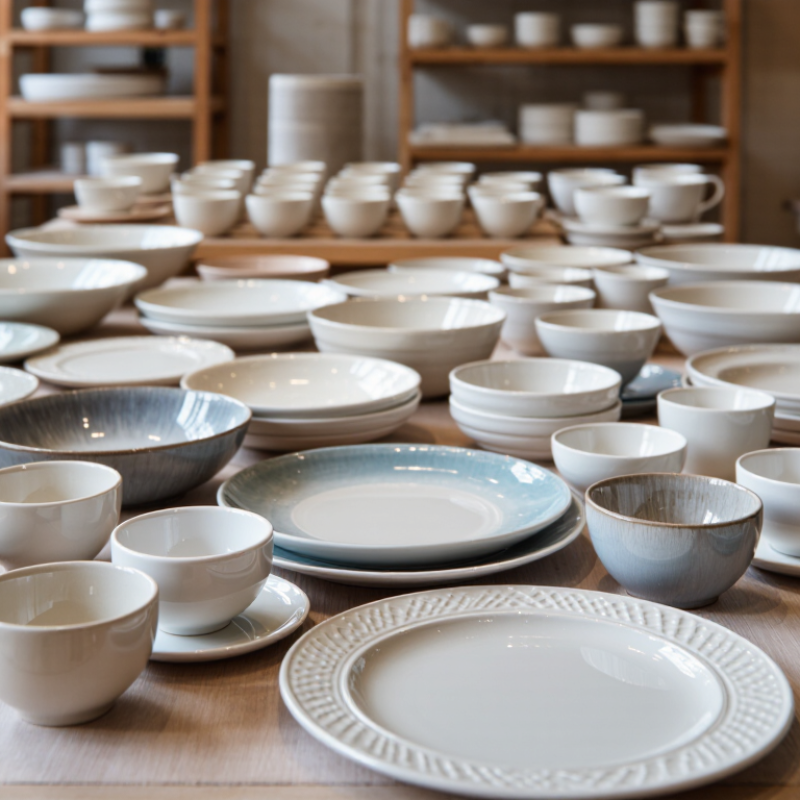
Market Scope: Ceramic Tableware CAGR and HS 6912 Trade Values (UN Comtrade)
2026 Top OEM Ceramic Tableware Manufacturers?
Market Scope: Ceramic Tableware CAGR and HS 6912 Trade Values (UN Comtrade)
The 2026 OEM ceramic tableware market should be assessed through capacity, export consistency, and product control. HS 6912 covers ceramic tableware and kitchenware, excluding porcelain and china. UN Comtrade trade values help reveal cross-border demand, but they do not measure factory revenue directly. Customs values can reflect freight terms, currency changes, and shipment timing.
CAGR estimates add a forward-looking view. However, the result depends heavily on the chosen base year, forecast period, and market definition. A report covering household tableware may show a different CAGR from one including hospitality and food-service supply. Check the methodology. Small wording differences can change the market size.
OEM buyers should compare HS 6912 export trends with practical factory evidence. Review kiln capacity, glaze testing, food-contact documentation, and defect records. Ask for recent production samples, not only digital catalogs. A stable exporter may show repeated shipment values across several years. That pattern can be more useful than one unusually large annual figure.
Data is imperfect.
UN Comtrade may contain reporting gaps, revised figures, or differences between exporter and importer records. Mirror statistics can help identify unusual gaps, but they are not automatically correct. Freight costs, minimum order quantities, packaging strength, and mold ownership also affect the final quotation. The strongest supplier shortlist combines trade data with audits, sample inspections, and clear written specifications.
OEM Factory Metrics: MOQ, Monthly Capacity, Lead Time, and OTIF Rate
2026 Top OEM Ceramic Tableware Manufacturers
For 2026 sourcing, factory metrics matter more than polished catalogs. Experienced buyers should verify MOQ, monthly capacity, lead time, and OTIF rate through production records. A practical MOQ often ranges from 500 to 3,000 pieces per design, depending on mold complexity and decoration. Ask for proof.
Monthly capacity should be separated by product type. A factory may produce 300,000 plates monthly, but only 80,000 hand-finished pieces. Check kiln schedules, molding lines, staffing, and recent shipment volumes. Capacity is seasonal. Peak periods can reduce available output by 20% or more. This detail is often overlooked.
Standard lead time may reach 35 to 60 days after artwork approval and deposit confirmation. New molds can add another 15 to 30 days. Reliable suppliers should report OTIF performance using shipment dates, not promised dates alone. An OTIF rate above 95% is a useful benchmark, but ask how delays are counted. Some factories exclude port congestion or buyer changes, making comparisons imperfect. Measure twice.
Request twelve months of delivery data, inspection reports, and corrective-action records. Compare sample quality with mass production, especially glaze color, rim alignment, and breakage rates. A supplier with lower MOQ may still create higher costs through rework and late replenishment. Factory visits, video audits, and third-party inspections strengthen confidence, though none replaces clear written commitments.
2026 Top OEM Ceramic Tableware Manufacturers? – OEM Factory Metrics: MOQ, Monthly Capacity, Lead Time, and OTIF Rate
Metrics are presented as anonymized 2026 OEM factory benchmark profiles. MOQ refers to the minimum order quantity for one design and color combination; OTIF means orders delivered on time and in full. Capacity and delivery performance vary by product mix, tooling, seasonality, inspection requirements, and shipping conditions.
Quality Controls: ISO 9001, AQL 2.5, and Food-Contact Compliance
2026 Top OEM Ceramic Tableware Manufacturers?
Reliable OEM ceramic tableware production depends on visible, repeatable quality controls. ISO 9001 helps organize purchasing, production records, inspections, and corrective actions. It does not guarantee perfect products. Factories can still miss small glaze pinholes or uneven rims.
AQL 2.5 provides a practical sampling standard for shipment inspections. Inspectors check appearance, dimensions, packing, and functional defects against an agreed plan. However, AQL is not a promise that every piece is flawless. Experienced manufacturers also inspect kiln temperature records, glaze batches, and product samples before mass production. Food-contact compliance requires more than a printed statement. Testing should cover migration risks, heavy metals, glaze safety, and the destination market’s requirements. Keep test reports and material declarations traceable to each production batch.
Tips: Ask for the ISO 9001 certificate scope, not only its logo. Request an AQL inspection report with sample size and defect classification. Review food-contact documents before approving the first bulk order. Check random pieces yourself. A clean sample can hide process weakness. Also, confirm how the factory handles rejected goods, rework, and corrective actions. That conversation often reveals more than polished sales documents.
Cost and Sustainability: Energy Intensity, Scrap Rate, and CO₂ Data
2026 Top OEM Ceramic Tableware Manufacturers?
Cost and Sustainability: Energy Intensity, Scrap Rate, and CO₂ Data
For OEM ceramic tableware, unit price is only one part of the sourcing decision. Buyers should request energy intensity in kWh per kilogram of fired ware. A modern tunnel kiln may perform near 2.5–4.5 kWh/kg, but product thickness, firing temperature, and kiln loading change the result. Ask for the measurement period. One good month proves little.
Scrap rate deserves equal attention. Ware can fail during casting, drying, glazing, firing, or final inspection. A reported 3% scrap rate sounds strong, yet it may exclude first-fire breakage or customer returns. Request stage-by-stage figures, not one polished percentage. Lower scrap reduces clay use, labor, packaging, and replacement shipments. It also protects margins.
CO₂ data should state its boundary clearly. Factory emissions may be reported as 0.8–1.8 kg CO₂e per kilogram of finished ware, depending on fuel, electricity, and allocation methods. Renewable electricity can improve results, but kiln fuel often remains the largest source. Verify utility bills, production volumes, calibration records, and recent audit dates. A site visit can reveal heat loss around kiln doors or dust-covered sensors. Small details matter.
The data will never be perfect. That is the uncomfortable part. Still, comparable methods create better decisions. For a 2026 supplier review, combine landed cost with energy intensity, verified scrap, and product-level CO₂ evidence. Ask manufacturers to explain weak months, not hide them.
2026 Top OEM Ceramic Tableware Manufacturers: Cost and Sustainability Benchmarks
Comparative manufacturing profiles based on finished tableware output. Lower values indicate better energy efficiency, lower production loss, and lower operational carbon intensity.
Energy intensity is measured in gigajoules per tonne of finished tableware, scrap rate represents unfired and fired production losses, and CO₂ intensity covers estimated kiln fuel and electricity emissions. The benchmark ranges reflect commonly reported ceramic manufacturing performance levels and are presented without company or brand identification.
2026 Ranking Matrix: Weighted Scores for Price, Quality, Capacity, and ESG
The 2026 OEM ceramic tableware ranking uses a weighted scorecard, not a simple price list. The assessment reviews factory quotations, sample records, production audits, and shipment evidence. Quality receives 35 percent, price 25 percent, capacity 25 percent, and ESG 15 percent. This balance reflects real buying pressure: attractive prices fail when glaze defects delay delivery. That happens.
Quality scoring checks glaze consistency, edge finishing, dimensional tolerance, food-contact documentation, and breakage rates from trial orders. Price scoring includes mold charges, decoration, packaging, freight assumptions, and payment terms. Capacity means verified monthly output, kiln availability, backup lines, and peak-season lead times. A factory claiming 500,000 pieces monthly deserves less credit without production records.
ESG scoring examines energy controls, wastewater handling, worker safety training, traceable materials, and corrective-action records. Evidence matters more than polished certificates. Still, the matrix has weaknesses. Audit dates vary, and smaller factories may document less despite sound workmanship. Scores should be refreshed after samples, pilot runs, and on-time delivery checks. A practical buyer can rank suppliers twice: before sampling and after production.
FAQS
It shows cross-border trade values for ceramic tableware and kitchenware, excluding porcelain and china. Customs values are not factory revenue. Freight terms, currency changes, and shipment timing can distort comparisons. Use the figures as signals, not final proof.
CAGR depends on the base year, forecast period, and market definition. One report may include household products only. Another may include hospitality and food-service supply. Check the methodology carefully. Small wording changes matter.
Compare export trends with factory evidence. Review kiln capacity, glaze testing, food-contact documents, and defect records. Request recent production samples instead of relying on digital catalogs. A factory visit helps, but it cannot replace written specifications.
A practical MOQ often ranges from 500 to 3,000 pieces per design. Mold complexity and decoration can change the requirement. Ask for production records supporting the stated MOQ. Low MOQ is not always cheaper.
Separate capacity by product type and finishing method. A factory may produce 300,000 plain plates monthly. Its hand-finished capacity may reach only 80,000 pieces. Check kiln schedules, molding lines, staffing, and recent shipments. Capacity changes seasonally.
Standard lead time may reach 35 to 60 days after artwork approval and deposit confirmation. New molds can add another 15 to 30 days. An OTIF rate above 95% is a useful benchmark. Ask how delays are counted. Port congestion may be excluded. Definitions are imperfect.
A structured quality system should cover purchasing, production records, inspections, and corrective actions. Ask for inspection reports showing sample size and defect categories. Review glaze color, rim alignment, dimensions, packaging, and breakage. A clean sample can hide process weakness.
Request test reports covering migration risks, heavy metals, and glaze safety. Confirm that documents match the destination market’s requirements. Trace each report to the relevant material and production batch. Also ask how rejected goods and rework are handled. Do not trust logos alone.
Conclusion
This article presents a practical 2026 framework for evaluating an OEM Ceramic Tableware Manufacturer. It begins by defining the market scope through ceramic tableware CAGR trends and HS 6912 trade values sourced from UN Comtrade, then compares factory performance using MOQ, monthly production capacity, lead time, and OTIF rate. These indicators help buyers assess whether a supplier can support consistent, scalable, and reliable production.
The evaluation also examines quality systems, including ISO 9001 implementation, AQL 2.5 inspection practices, and food-contact compliance. Cost and sustainability are measured through energy intensity, scrap rate, and available CO₂ data. Finally, a weighted ranking matrix combines price, quality, capacity, and ESG performance to create a balanced comparison. This approach helps purchasing teams identify suitable manufacturing partners based on transparent operational evidence rather than price alone, while supporting responsible sourcing and long-term supply stability.